
The System Performance Overview gives us a high-level understanding of system-level performance, with the total households and people served in the time-frame, the average cumulative days homeless, the percentage of exits that were to permanent housing and the rate of returns to homelessness.

The second view is the System Performance Map. This chart maps how households move through the homeless system, with different combinations of project types.
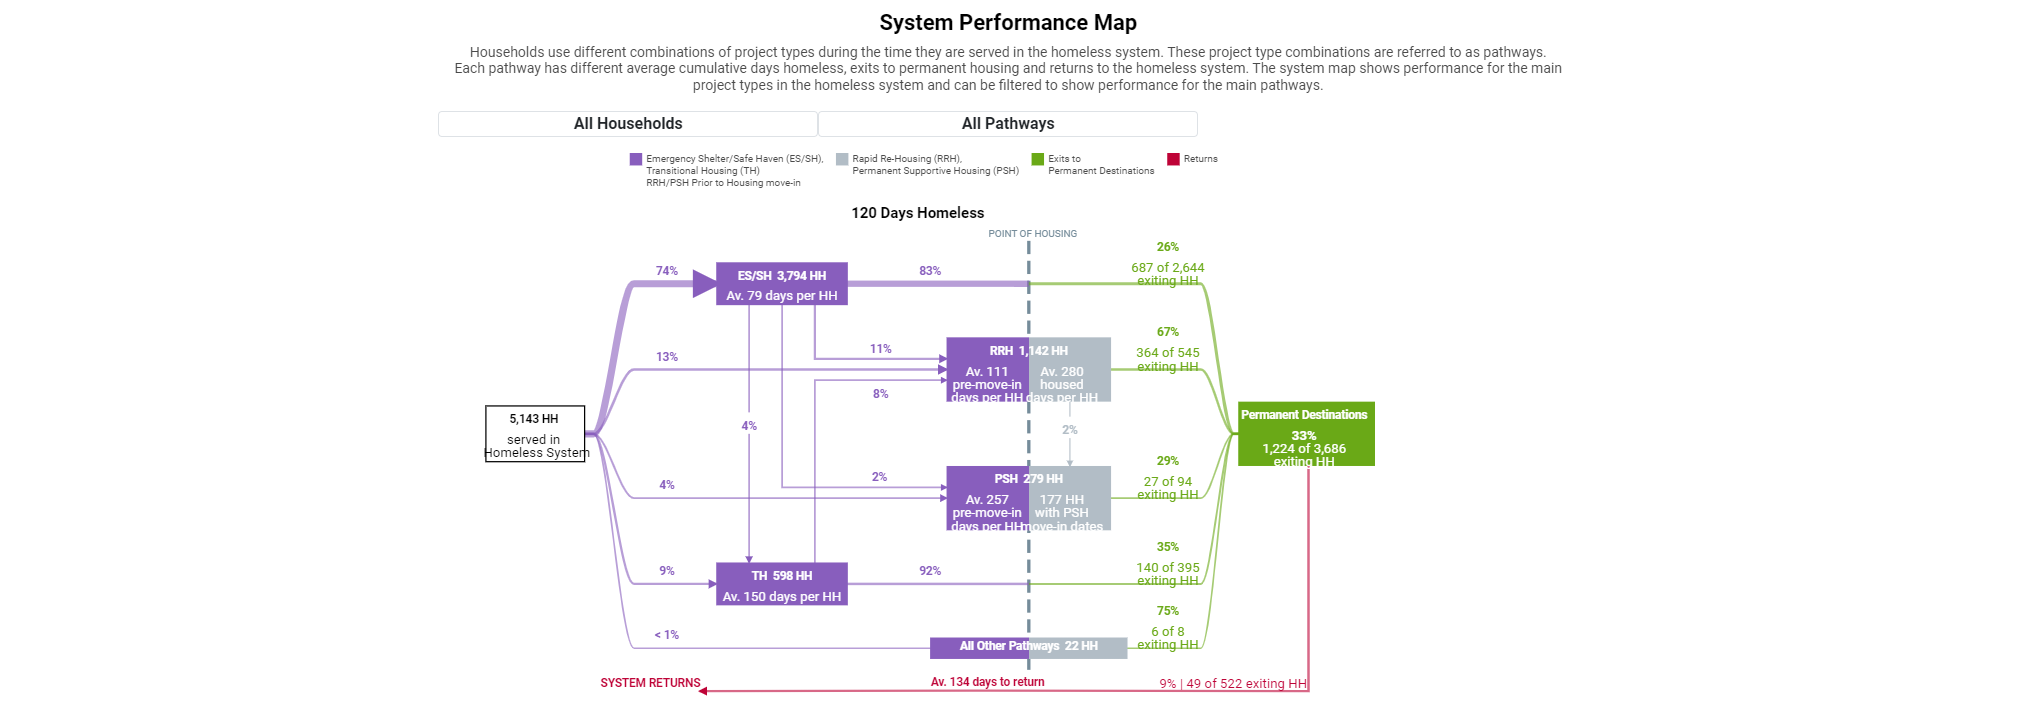 Households use different combinations of project types during the time they are served in the homeless system. These project type combinations are referred to as pathways. Each pathway has different average cumulative days homeless, exits to permanent housing and returns to the homeless system. The system map shows performance for the main project types in the homeless system (Emergency Shelter, Transitional Housing, Rapid ReHousing, Permanent Supportive Housing).[/caption]
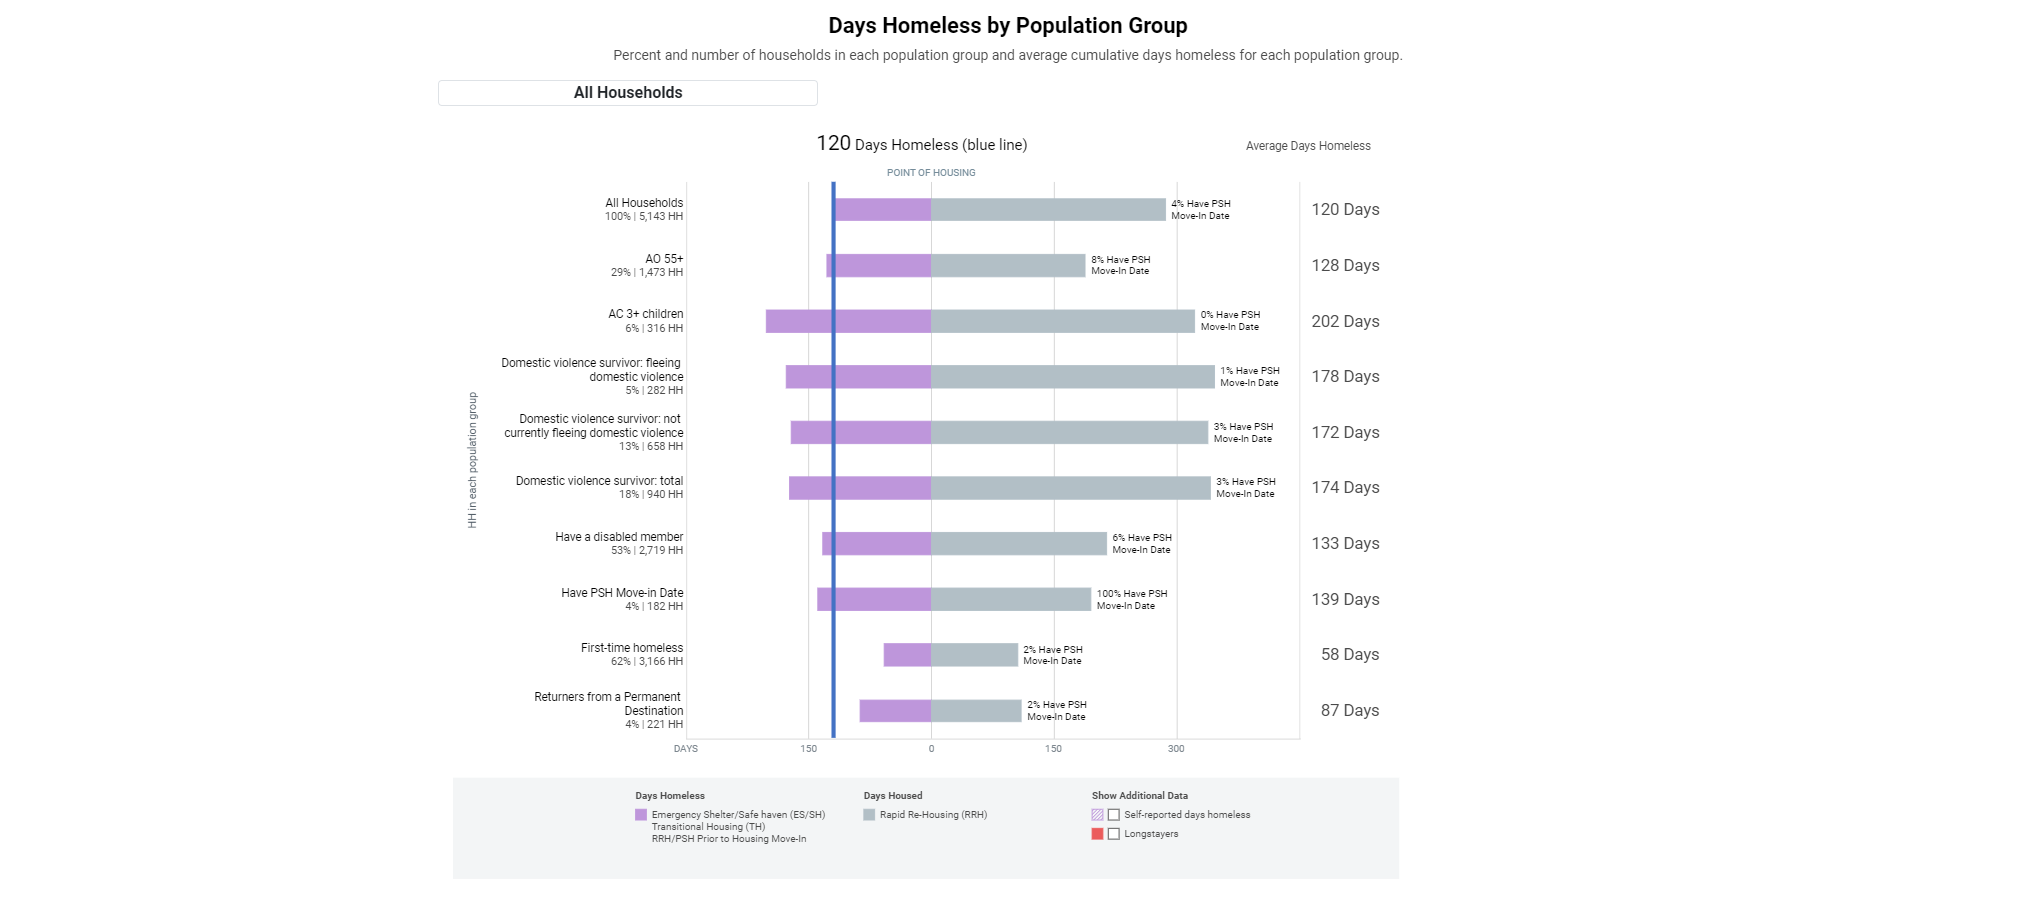
Our first big metric: Days Homeless. This calculation is different from other federal reporting about the number of days people are homeless in one notable way; permanent housing projects, and the time people spend searching for housing while enrolled in these projects, is counted towards the cumulative days homeless. Days Homeless is also presented by household type. With the below visual, we can see that Adult & Child households are homeless in projects longer than Adult Only households.
 This chart shows the average cumulative days households were served in ES, SH and TH projects, and in RRH or PSH projects before move-in for households in the number at left and for each household type in the bars on the right. Days Homeless also includes contiguous or uninterrupted time in these projects prior to the report period.
 This view shows average days homeless by different pathway groupings. This can be useful for measuring system engagement and how it relates to days homeless. Some important limitations to keep in mind is that system engagement with project types such as Street Outreach, Coordinated Entry, and Supportive Service projects is not counted in the days homeless.

Additionally, we cross-section Days Homeless by population groups such as; parenting youth, households aged 55+, households with disabilities, different racial groups, and households fleeing domestic violence, etc. One important way we can use this cross-section is to understand the average days homeless by race.
 This data can be further filtered in Stella by household types, including households with veterans, and can also be calculated by self-reported days homeless which includes a household’s lived experience of homelessness prior to system engagement.

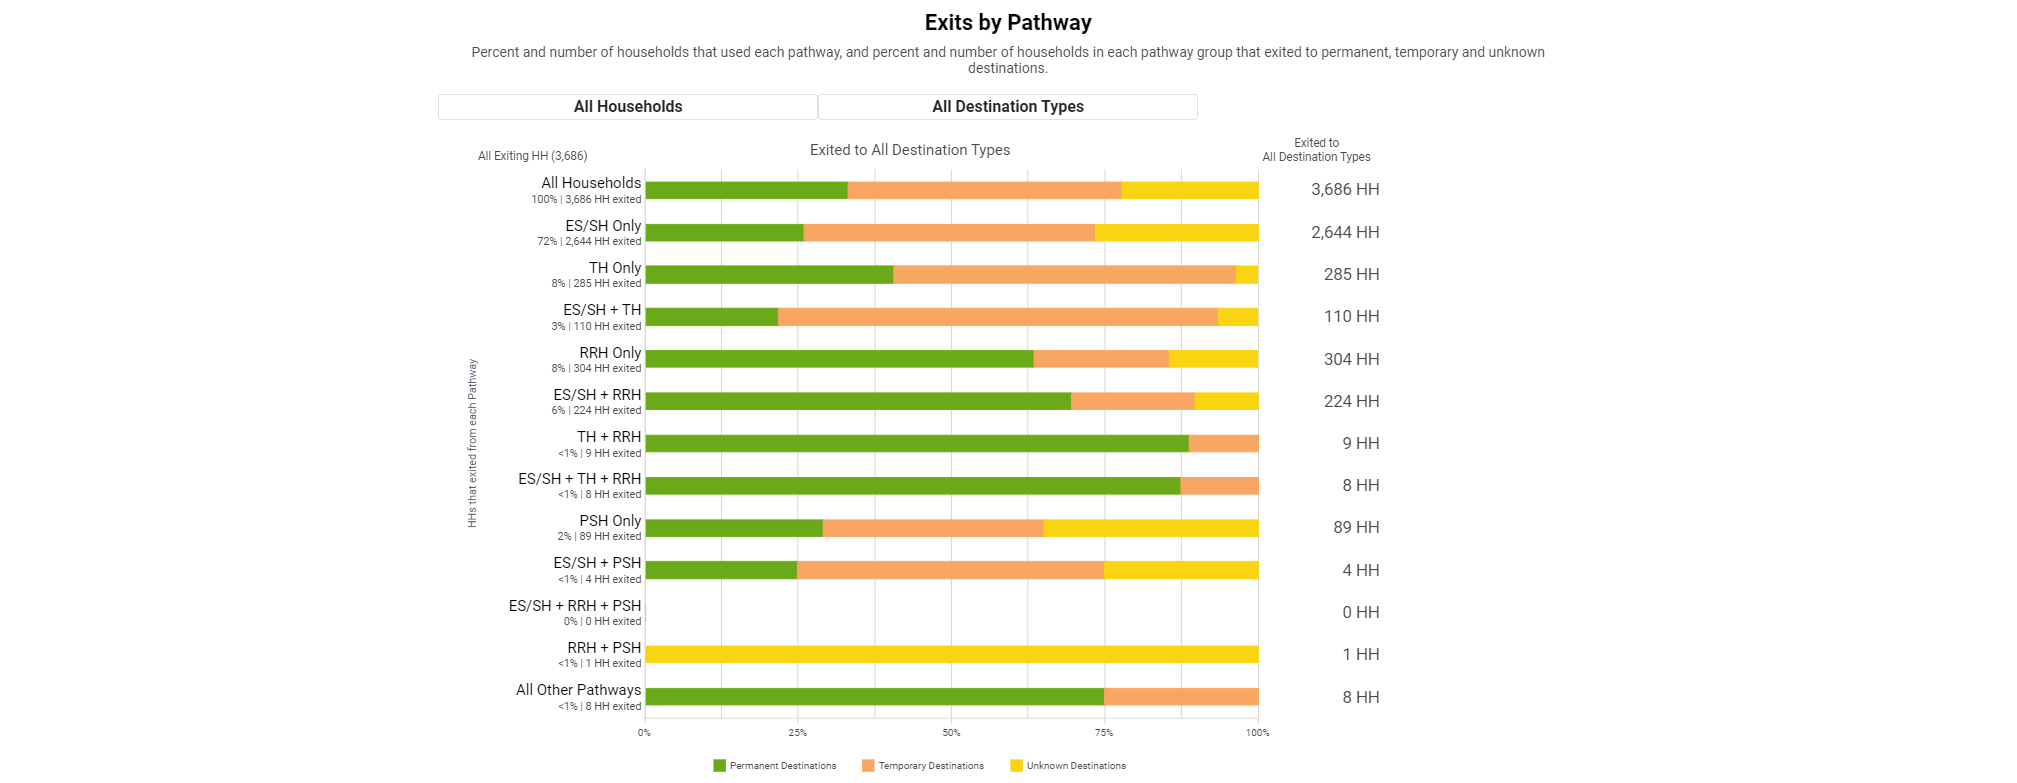
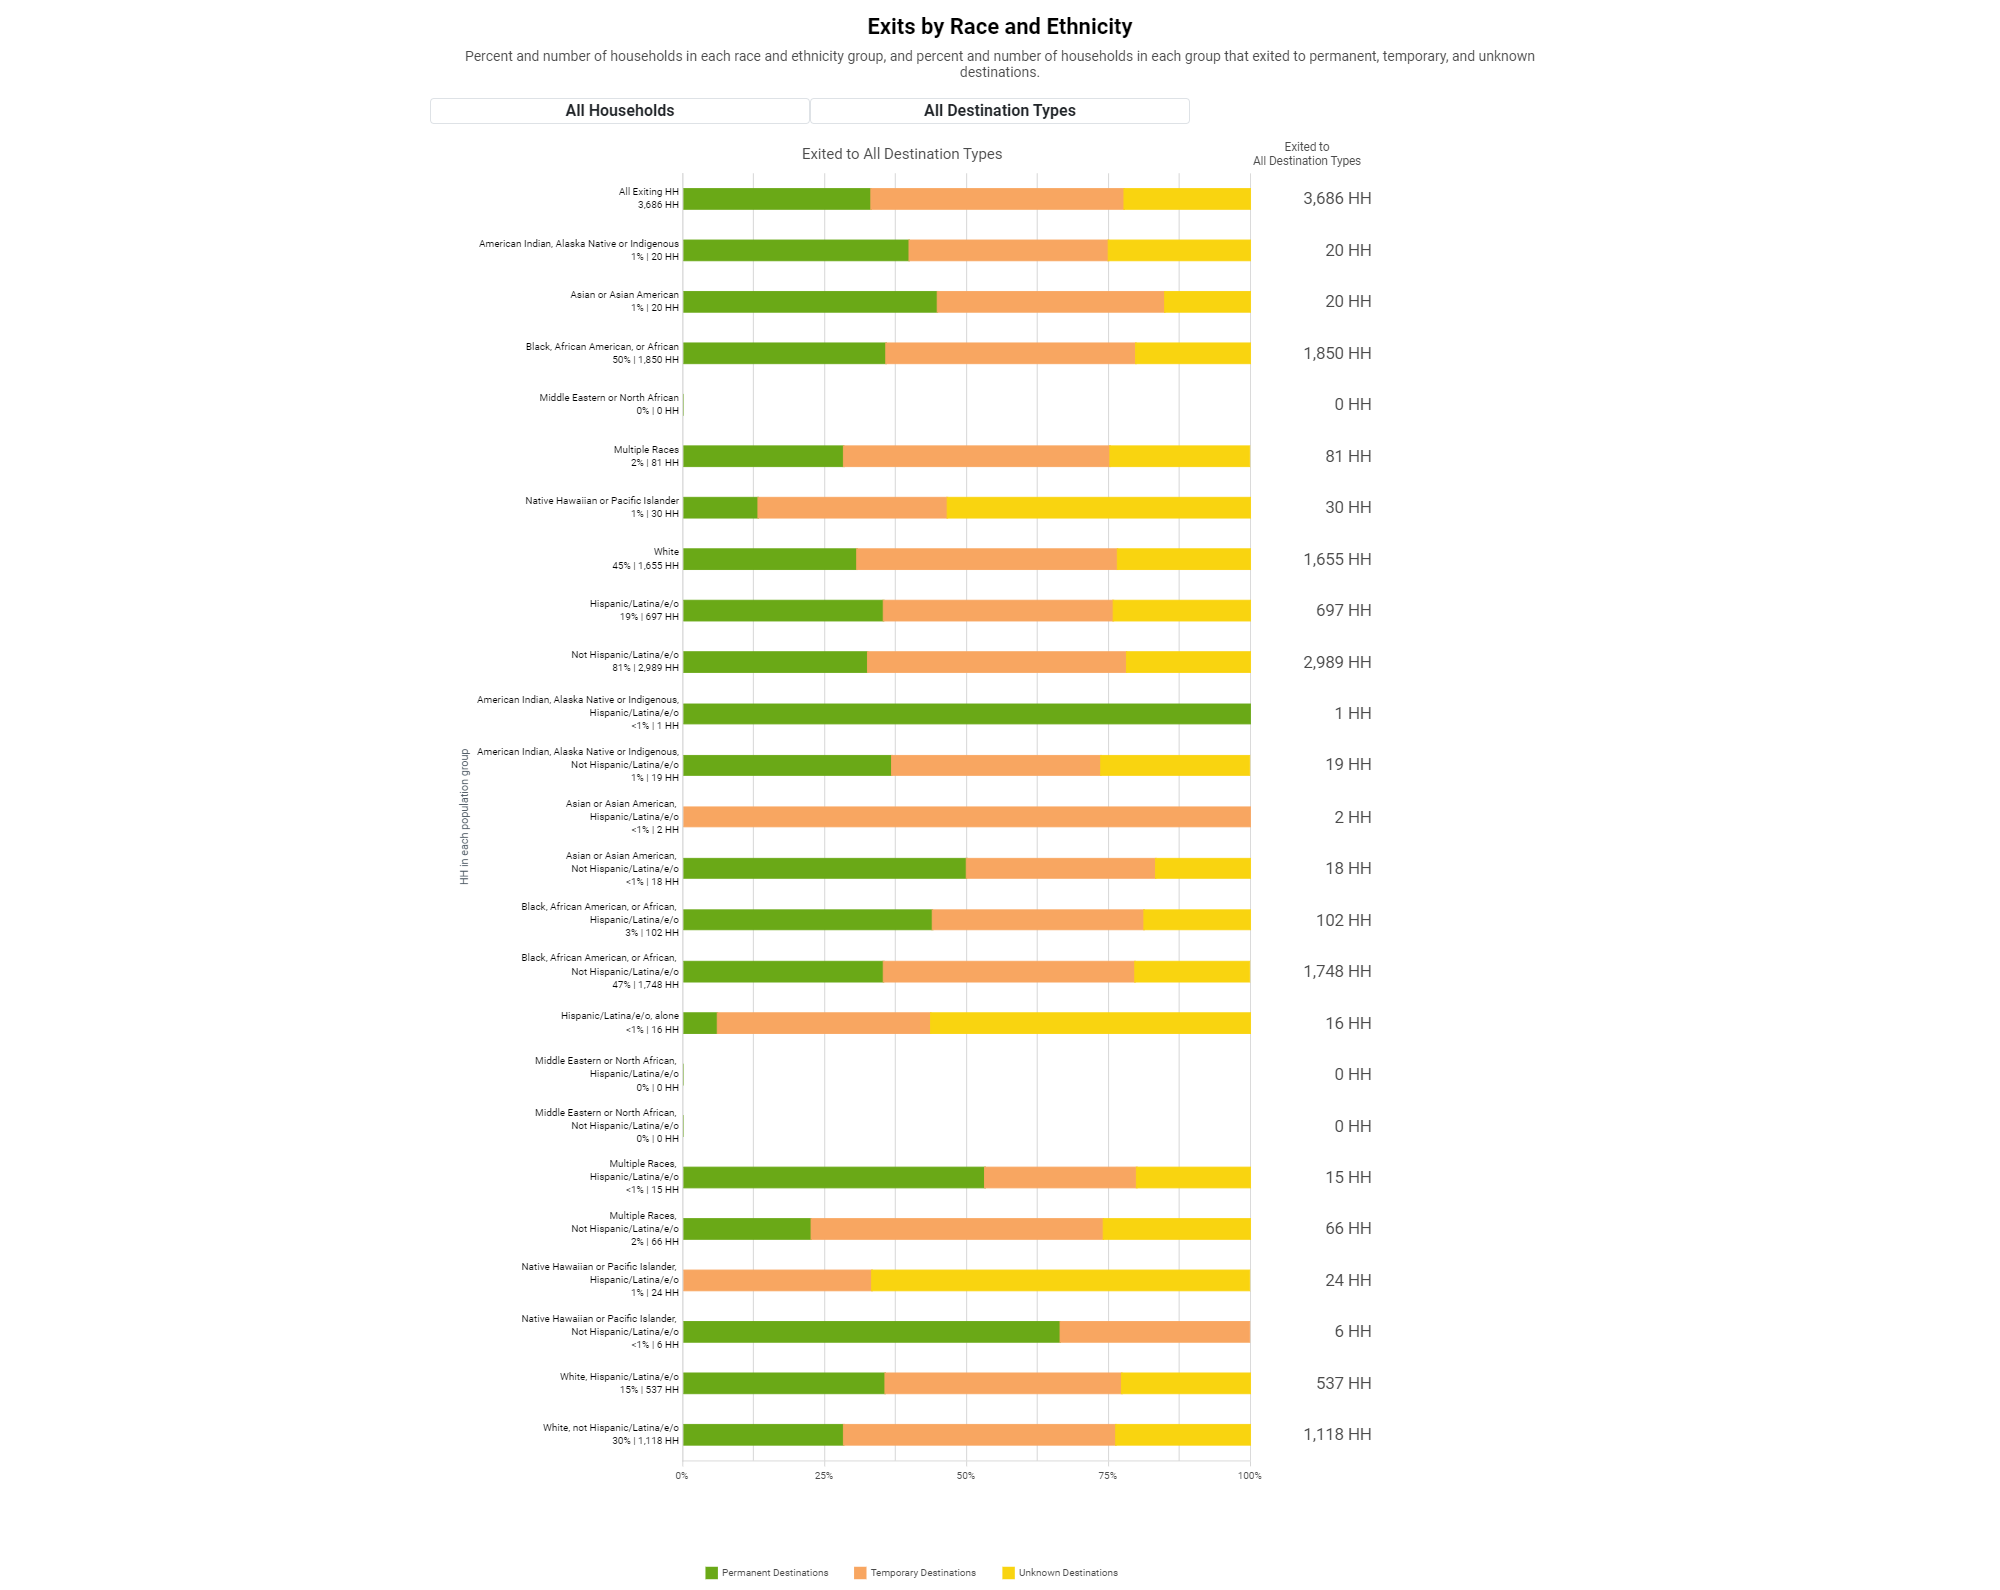
When All Destination Types is selected, the bars show the proportion of exits by destination type with the section on the left indicating permanent destinations, the section in the middle indicating temporary destinations, and the section on the right indicating unknown destinations.

This chart shows the percent of households who returned to the homeless system within six months of exiting to a permanent destination. For each household type, the upper bar shows exits to permanent destinations and the lower bar shows the percent that returned to the homeless system within six months.
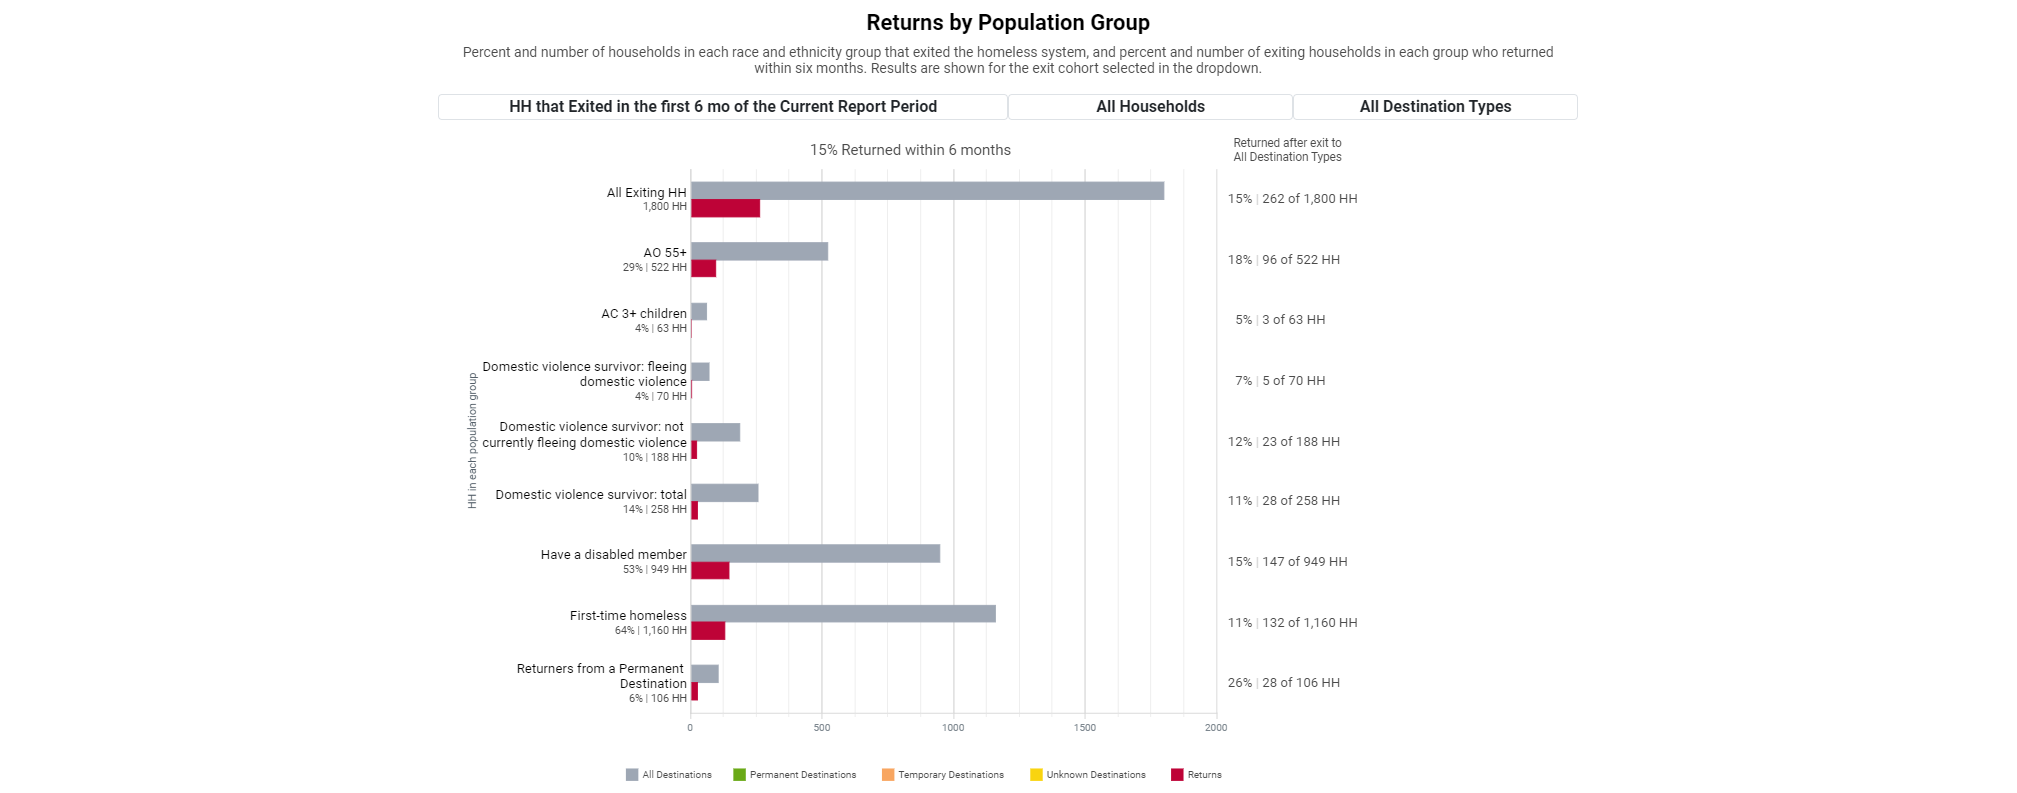
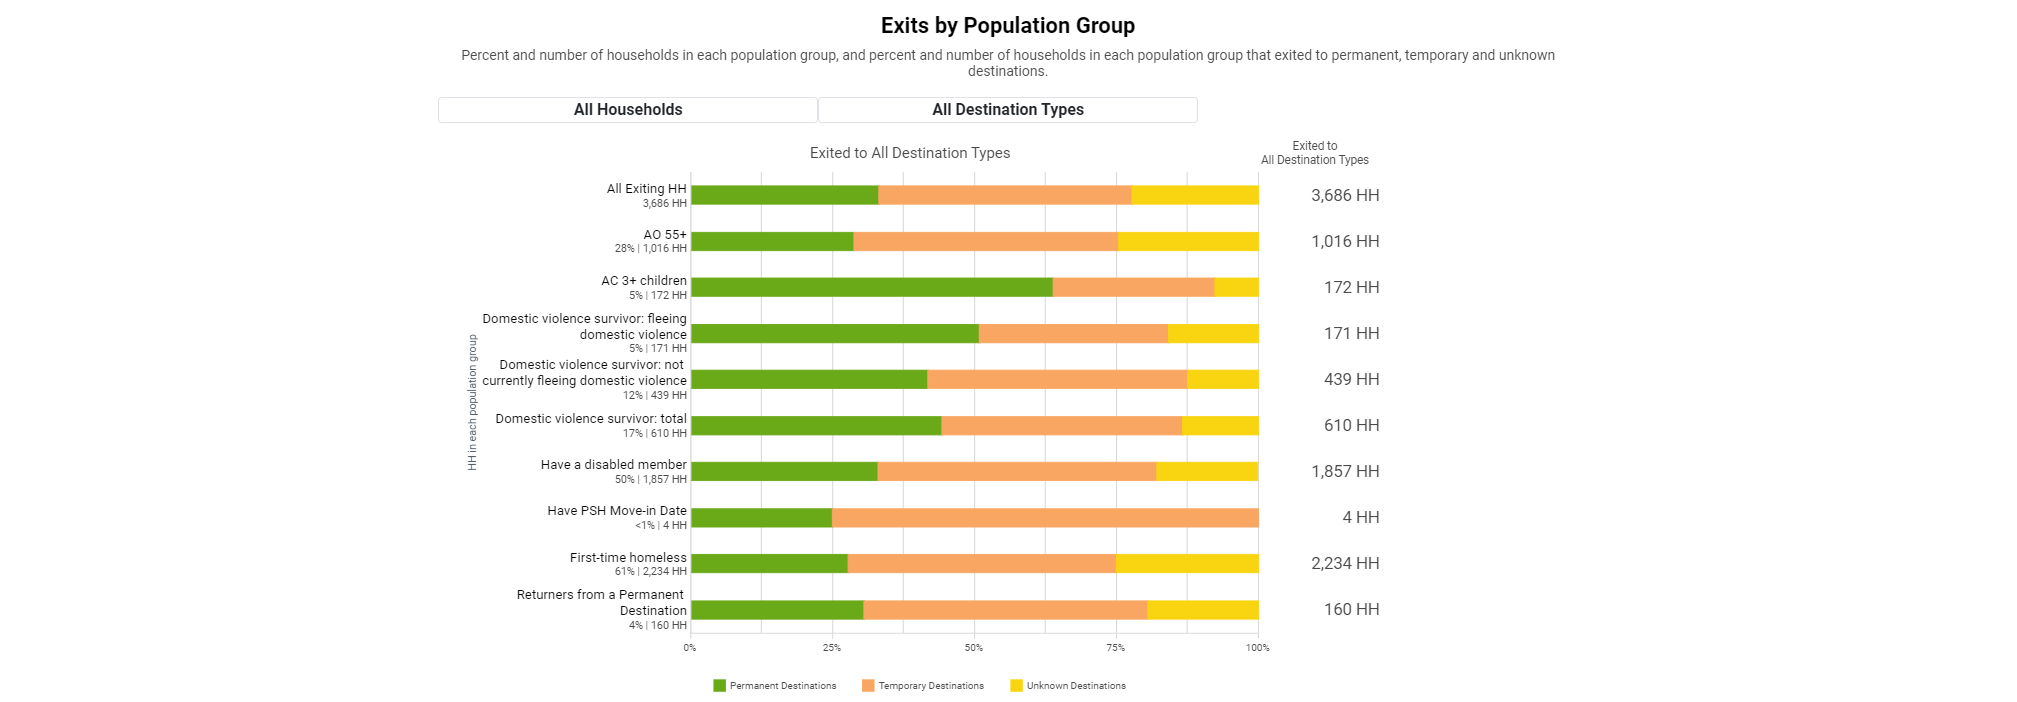
This chart shows returns to the homeless system within six months of exit for households with certain demographic or system utilization characteristics called population groups. The top bar for each population group shows the percent of households that exited. The bar on the bottom shows the proportion that returned within six months of exiting.

Demographics are a large part of what makes Stella such a powerful tool for analysis. Understanding differences in system-level participation and performance by subpopulations can inform nuanced decision-making. One piece of this is simply understanding how many households a certain project type serves in a given year. Here we can see the vast majority of households interacting with our homeless response system do so in shelters and transitional housing.

Looking further at system engagement for households in shelters and transitional housing, we can understand what proportion is homeless for the first time vs continuously homeless, what proportion is a Veteran, what proportion is chronically homeless, and the household composition.

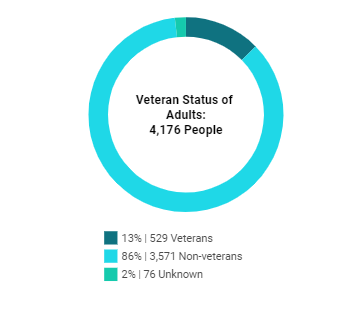
Veterans are adults who have been on active duty in the armed forces of the United States. Non-Veterans are adults who have not been on active duty in the armed forces of the United States. Adults whose veteran status was recorded as “unknown,” “refused,” or “data not collected” are included in Unknown veteran status.

A person is counted as chronically homeless if they report the following conditions: – Either 365 continuous days homeless OR 365 cumulative days homeless during four or more episodes over the past three years, AND – Have a disabling condition.
This chart displays household composition categories based on the the number of adults and children who make up each household for all households that were served in the household type and project type selected.